In the process of drug development, efficacy and safety are the major reasons for failure. Evaluating the absorption, distribution, metabolism, excretion, and toxicity (ADMET) of agents at an early stage plays a vital role in R&D. Here, we have developed pepADMET, the first comprehensive peptide-ADMET prediction platform. Based on an extensive database of 36,643 entries, pepADMET provides users with predictions for 29 ADMET endpoints and systematic analyses to accelerate peptide drug discovery.
The cleaned and specialized datasets that fed into the models were summarized as follows:
| Properties | Total (positive/Negative) | training set (positive/Negative) | test set (positive/Negative) | valuation set (positive/Negative) |
|---|---|---|---|---|
| LogD7.4 | 257 | 192 | 65 | - |
| F | 305 (117/188) | 228 (87/141) | 77 (30/47) | - |
| Caco-2 | 886 | 664 | 222 | - |
| PAMPA | 6698 | 5023 | 1675 | - |
| RRCK | 181 | 135 | 46 | - |
| BBB | 850 (425/425) | 636 (318/318) | 214 (107/107) | - |
| T1/2 | 970 | 727 | 243 | - |
| Toxicity | 14660 (8197/6465) | 11729 (6557/5170) | 1467 (820/647) | 1466 (820/646) |
| Cytolysis | 121 | 96 | 13 | 12 |
| GPCR toxin | 130 | 104 | 13 | 13 |
| Neurotoxin | 848 | 678 | 85 | 85 |
| Cytotoxicity | 621 | 497 | 62 | 62 |
| Hemostasis | 148 | 118 | 15 | 15 |
| Hemolysis | 6656 | 5324 | 666 | 666 |
| AChR inhibitor | 195 | 156 | 20 | 19 |
| Ca2+ inhibitor | 124 | 99 | 13 | 12 |
| K+ inhibitor | 274 | 219 | 28 | 27 |
| Na+ inhibitor | 295 | 236 | 30 | 29 |
| HC50 | 2423 | 1938 | 243 | 242 |
LogD7.4 refers to the logarithm of the distribution coefficient of a compound
at pH 7.4 (physiological pH). Since pH 7.4 is the typical pH of human blood,
logD7.4 is one of the commonly used parameters in drug development to assess
the balance between lipophilicity and hydrophilicity of a drug under
physiological conditions.
Methods
We collected 257 data from databases and literature. PyBioMed and modlAMP were used to calculate peptide descriptors and small molecular descriptors. Six advanced machine learning algorithms, including RF, XGBoost, SVR, DT, GBT, and LightGBM were used to construct the regression models.
Model Performance
The best performance was achieved by using the GBT algorithms with R2 = 0.820 for CV and R2 = 0.818 for the test.
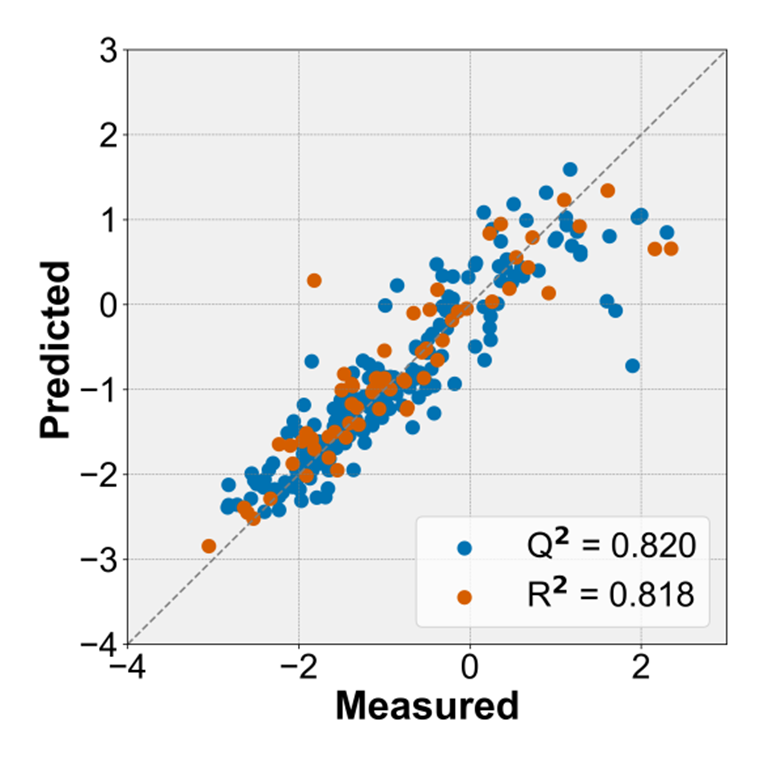
Figure 1. The predicted LogD7.4 versus the experimental values for 5-fold cross-validation and test set.
Bioavailability is a crucial factor in drug development,
as it determines the extent to which a drug reaches
its target site in the body and exerts its therapeutic effect.
Methods
By setting appropriate keywords, 305 data were collected from public publications. PyBioMed and modlAMP were used to calculate small molecular descriptors and peptide descriptors. After recursive feature elimination by random forest algorithm, a subset of features containing 141 descriptors was retained as model input. Five advanced machine learning algorithms,
including RF, XGBoost, SVM, DT, and LightGBM were used to construct models.
Model Performance
By combining different algorithms with descriptors, the best model achieved an AUC of 0.901 and 0.90 on 5-CV and the test.
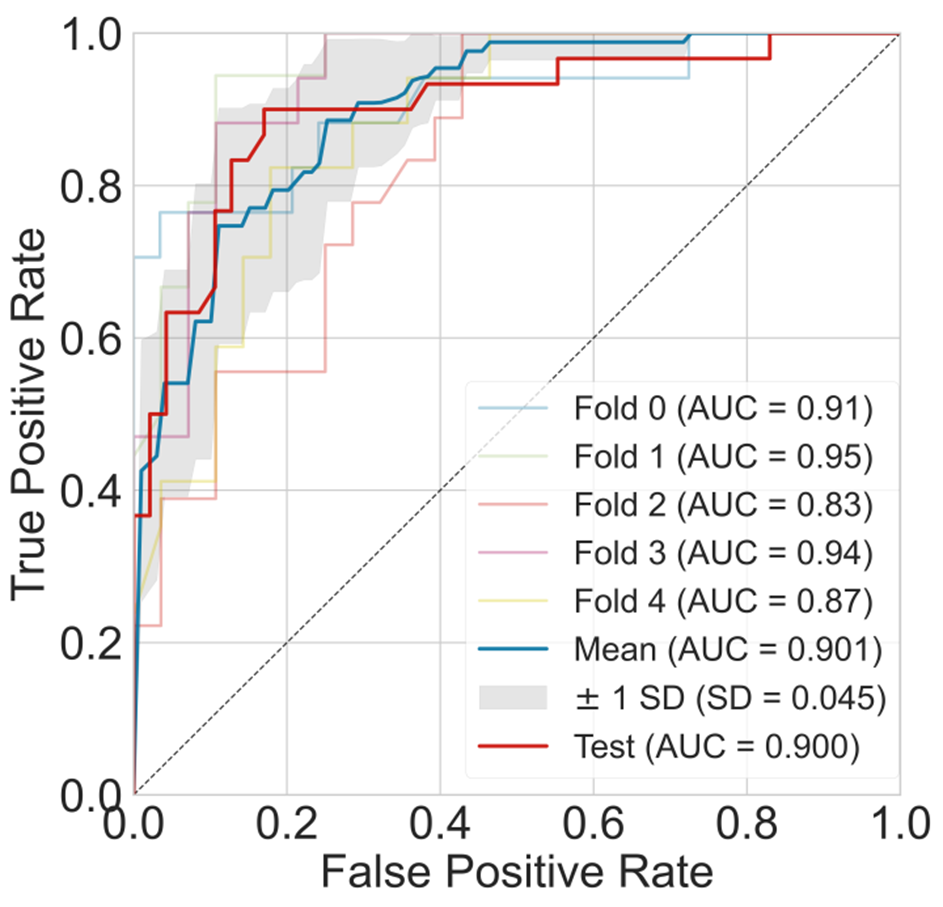
Figure 2. The AUC curve of the best models for bioavailability prediction.
Permeability is the ability of a peptide molecule to cross cellular or biological
membranes and is one of the key determinants of intestinal absorption and oral
bioavailability. Commonly used in vitro models such as Caco-2,
PAMPA and RRCK can be used to assess permeability.
During peptide drug development, the assessment of permeability helps to ensure
that the drug is able to overcome biological barriers for effective delivery and therapeutic
efficacy.
Dataset
Through systematic data collection, filtering, and de-duplication,
we gathered 7,765 high-quality entries from the CycPeptMPDB database
and public publications. These entries were categorized by different
cell lines and structural types, resulting in five distinct datasets,
as shown in Figure 3.
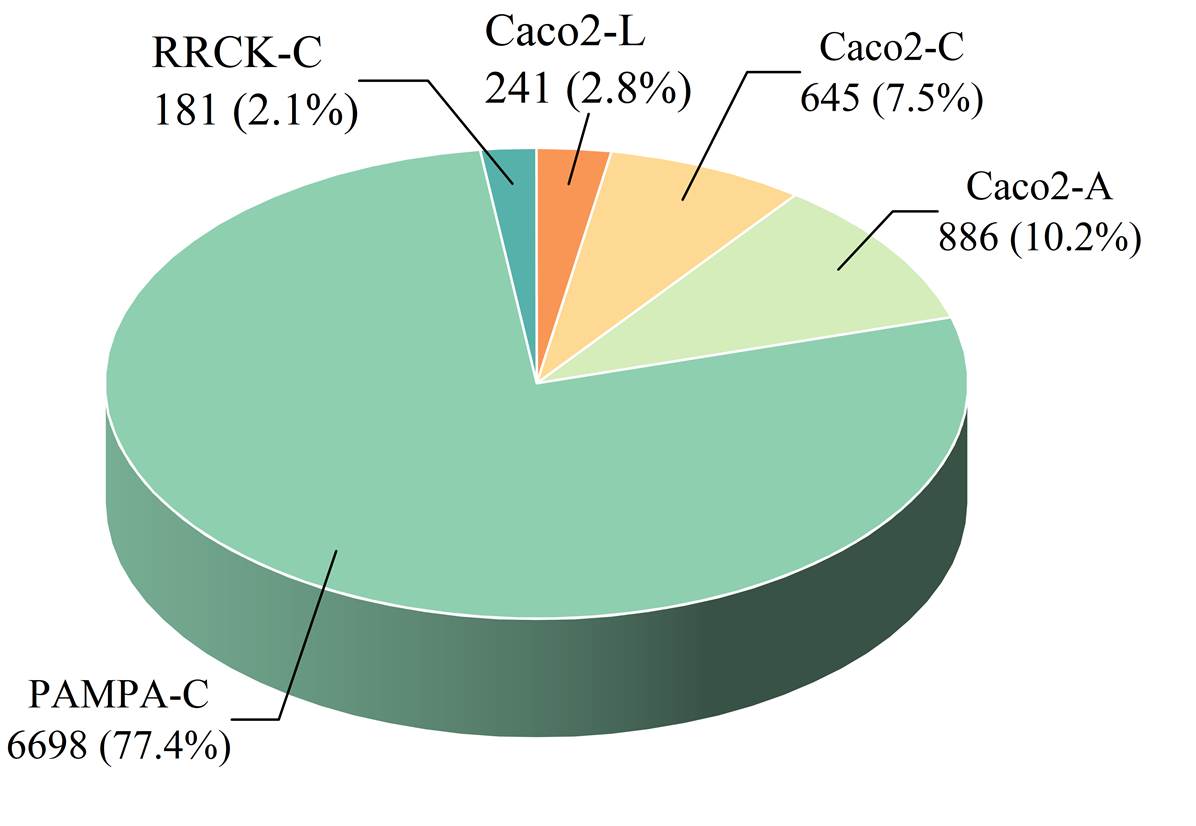
Figure 3. The data distribution across the five permeability datasets.
Methods
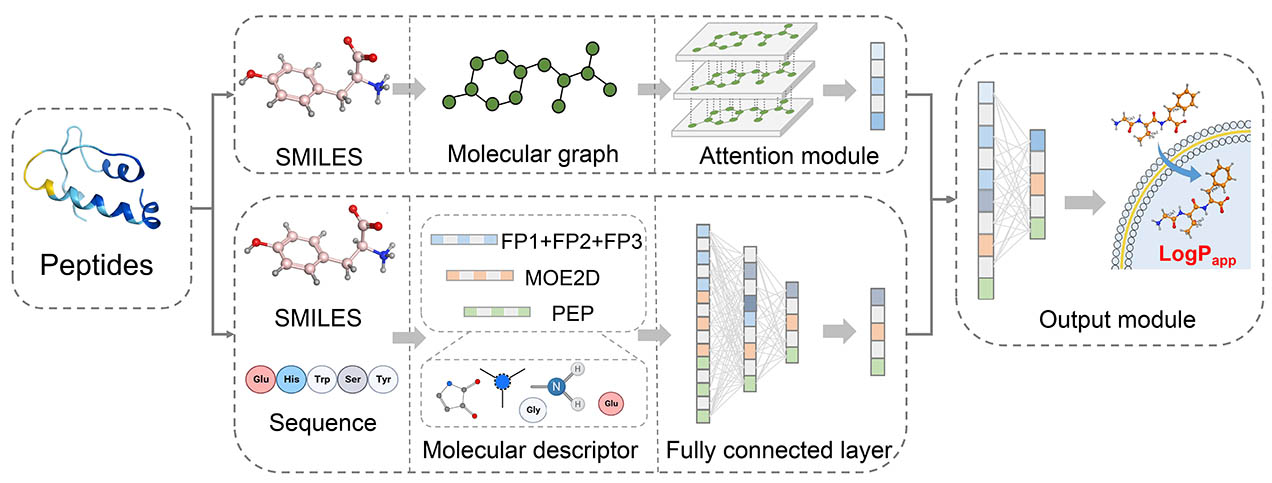
Figure 4. Overview of GNN framework for permeability prediction across diverse barriers.
Model performance
The best performance of the five models was achieved by MOE2D-SVR, MOE2D-LightGBM, MOE2D-RF, MOE2D-RF and MOE2D-RF. The details were shown below.
Considering that MOE2D descriptors rely on external software for computation,
we chose to deploy and use the suboptimal models for prediction.
Their predictive performance on 5-CV and test set was as follows:
R2 = 0.411 and 0.435 for the Caco2-L model, R2 = 0.582 and 0.527 for the Caco2-C model,
R2 =0.500 and 0.476 for the Caco2-A model, R2 =0.646 and 0.657 for the PAMPA-C model,
R2 =0.691 and 0.623 for the RRCK-C model.
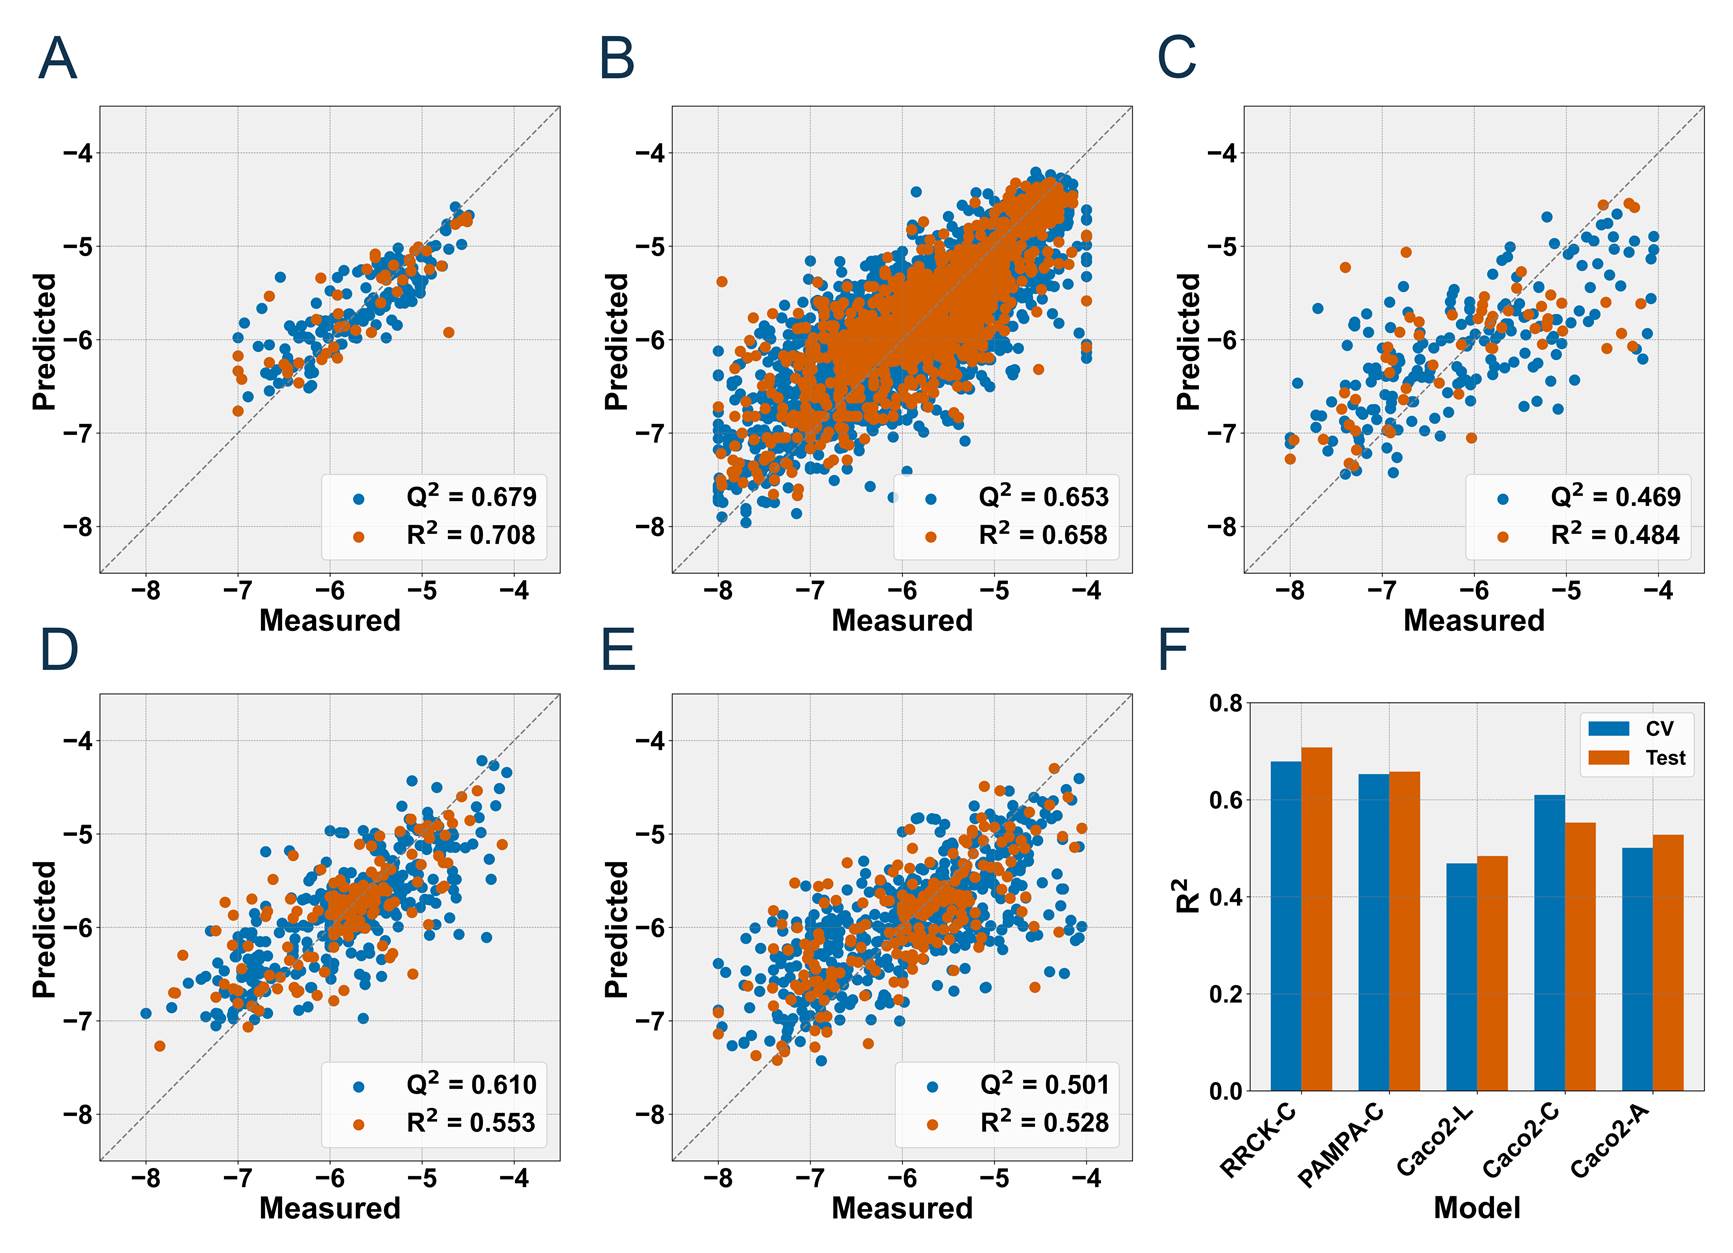
Figure 5. Predictive performance of the five optimal models.
Blood-brain barrier peptides (BBBPs) are peptides that can cross
the blood-brain barrier (BBB) and enter the central nervous system.
These molecules serve as efficient drug delivery tools for treating
central nervous system diseases, while also promoting the development
of novel drug carriers and more precise brain-targeted therapeutic strategies.
Methods
We collected 850 data from public publications and databases,
including 425 positive and 425 negative samples.
PyBioMed and modlAMP were used to calculate small molecular descriptors
and peptide descriptors. After recursive feature elimination
by random forest algorithm, a subset of features containing 121 descriptors
was retained as model input. Five advanced machine learning algorithms,
including RF, XGBoost, SVM, DT, and LightGBM were used to construct models.
Model Performance
The PEP-RF model reported the best performance for the BBB prediction
with a cross-validation AUC of 0.894 and an external test AUC of 0.889.
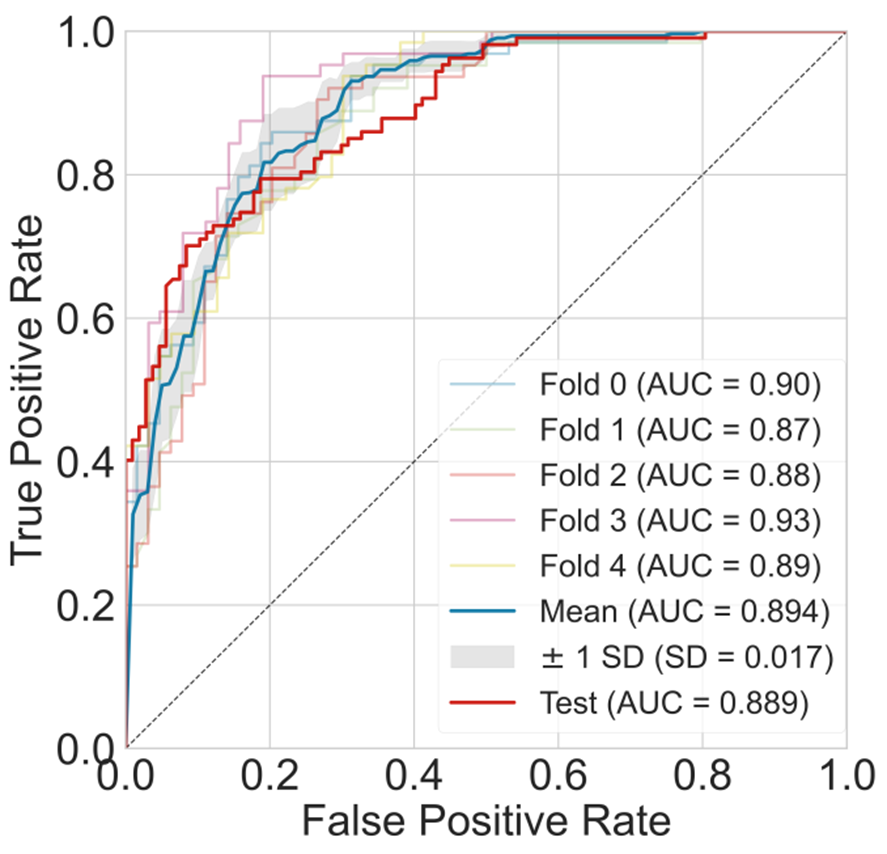
Figure 6. The AUC curve of the best models for BBB prediction.
Half-life refers to the time required for the maximum concentration
of a peptide drug in plasma to decrease by half.
This parameter reflects the metabolic and clearance rates of peptides
in the body and serves as an important reference for drug design and treatment planning.
Dataset
A strict pipeline was customized for data collection and pre-processing.
The data were sourced from the PEPlife database, PepTherDia database,
THPdb database, and public publications. After data cleaning, filtering,
and de-duplication, a total of 970 peptide half-life records were obtained.
These records were categorized into five datasets based on different species and organs,
as shown in Figure 7.
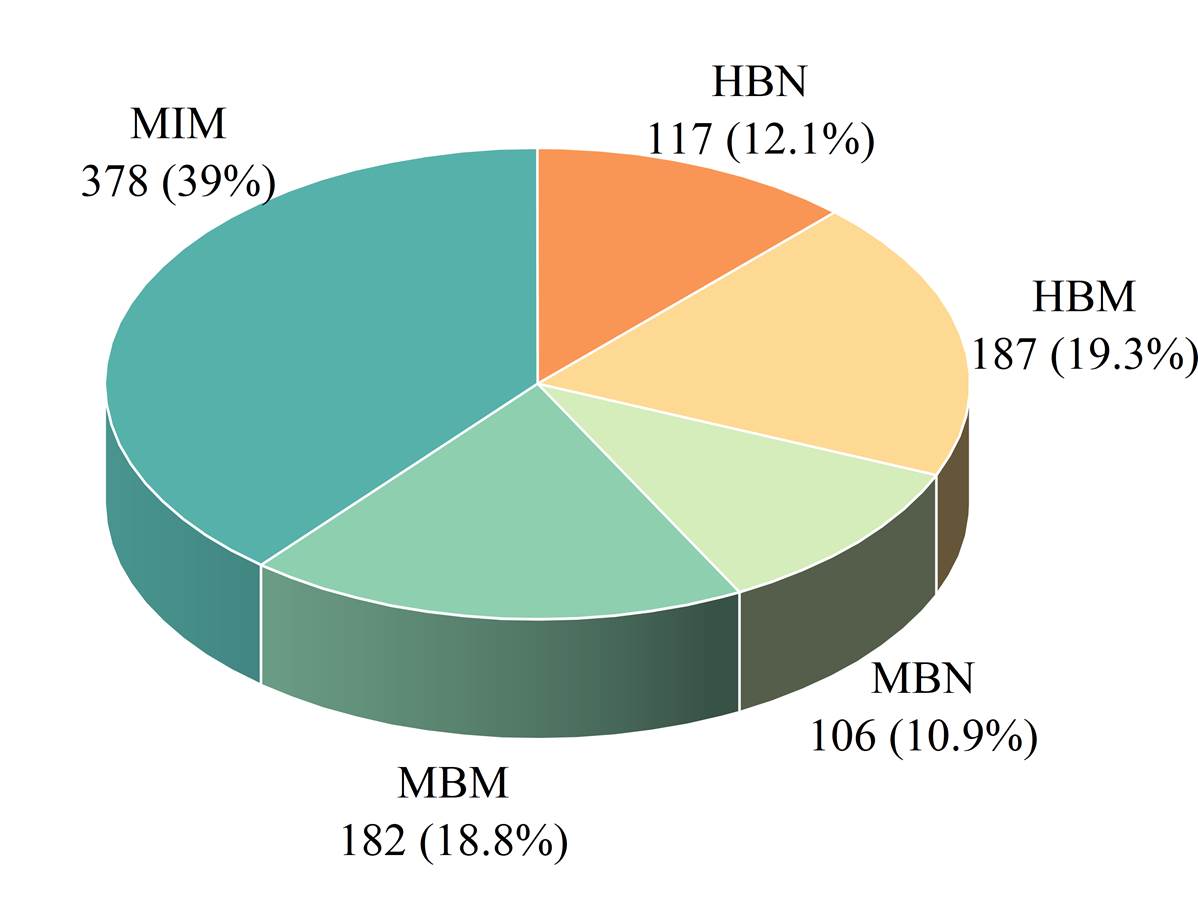
Figure 7. The data distribution across the five half-life datasets. The HBN represents the half-life of natural peptides in human blood. The HBM represents the half-life of modified peptides in human blood. The MBN represents the half-life of natural peptides in mouse blood. The MBM represents the half-life of modified peptides in mouse blood. The MIM represents the half-life of modified peptides in the mouse intestine.
Methods
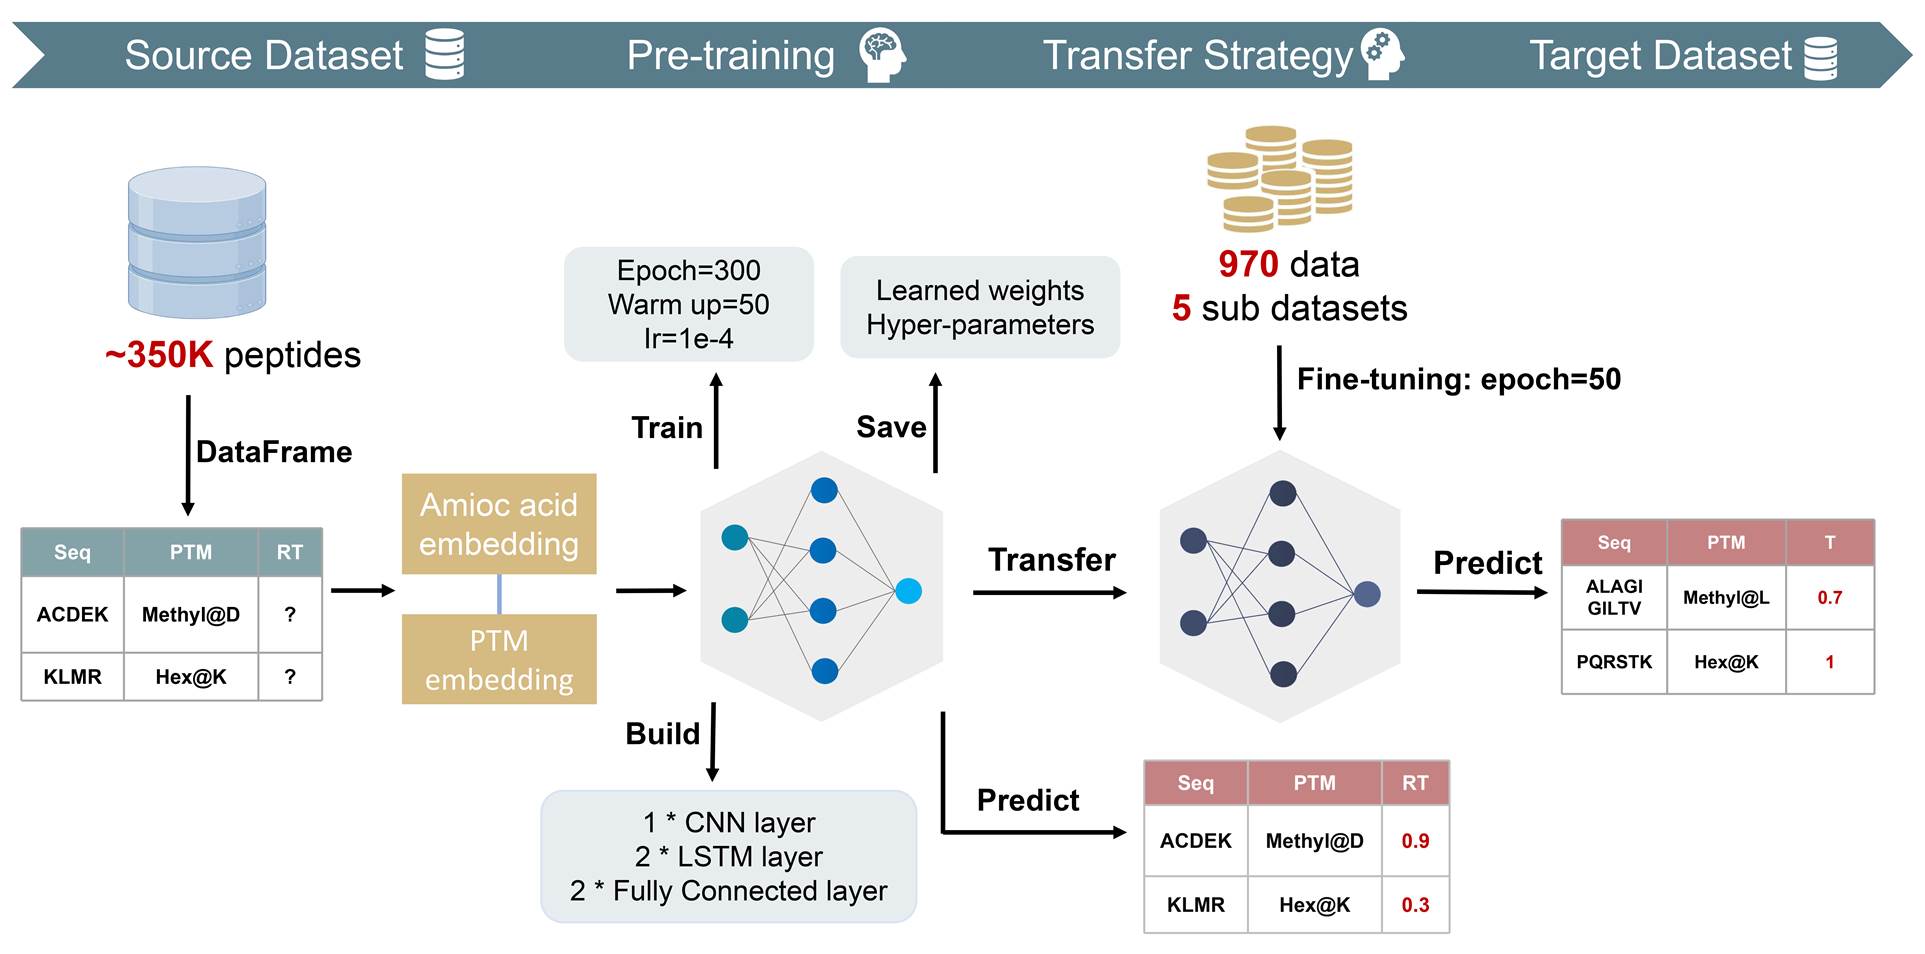
Figure 8. Workflow of the transfer learning strategy.
Model performance
Results showed that the introduction of enzymatic cleavage features
can improve model performance but not so obviously, the application
of transfer learning significantly enhanced the model’s predictive power,
and the optimal models achieved excellent R2of 0.84, 0.90, 0.984, 0.93, and
0.94 for the test, respectively, which improved about 15%
in terms of the correlation compared to related work. The details were shown below.
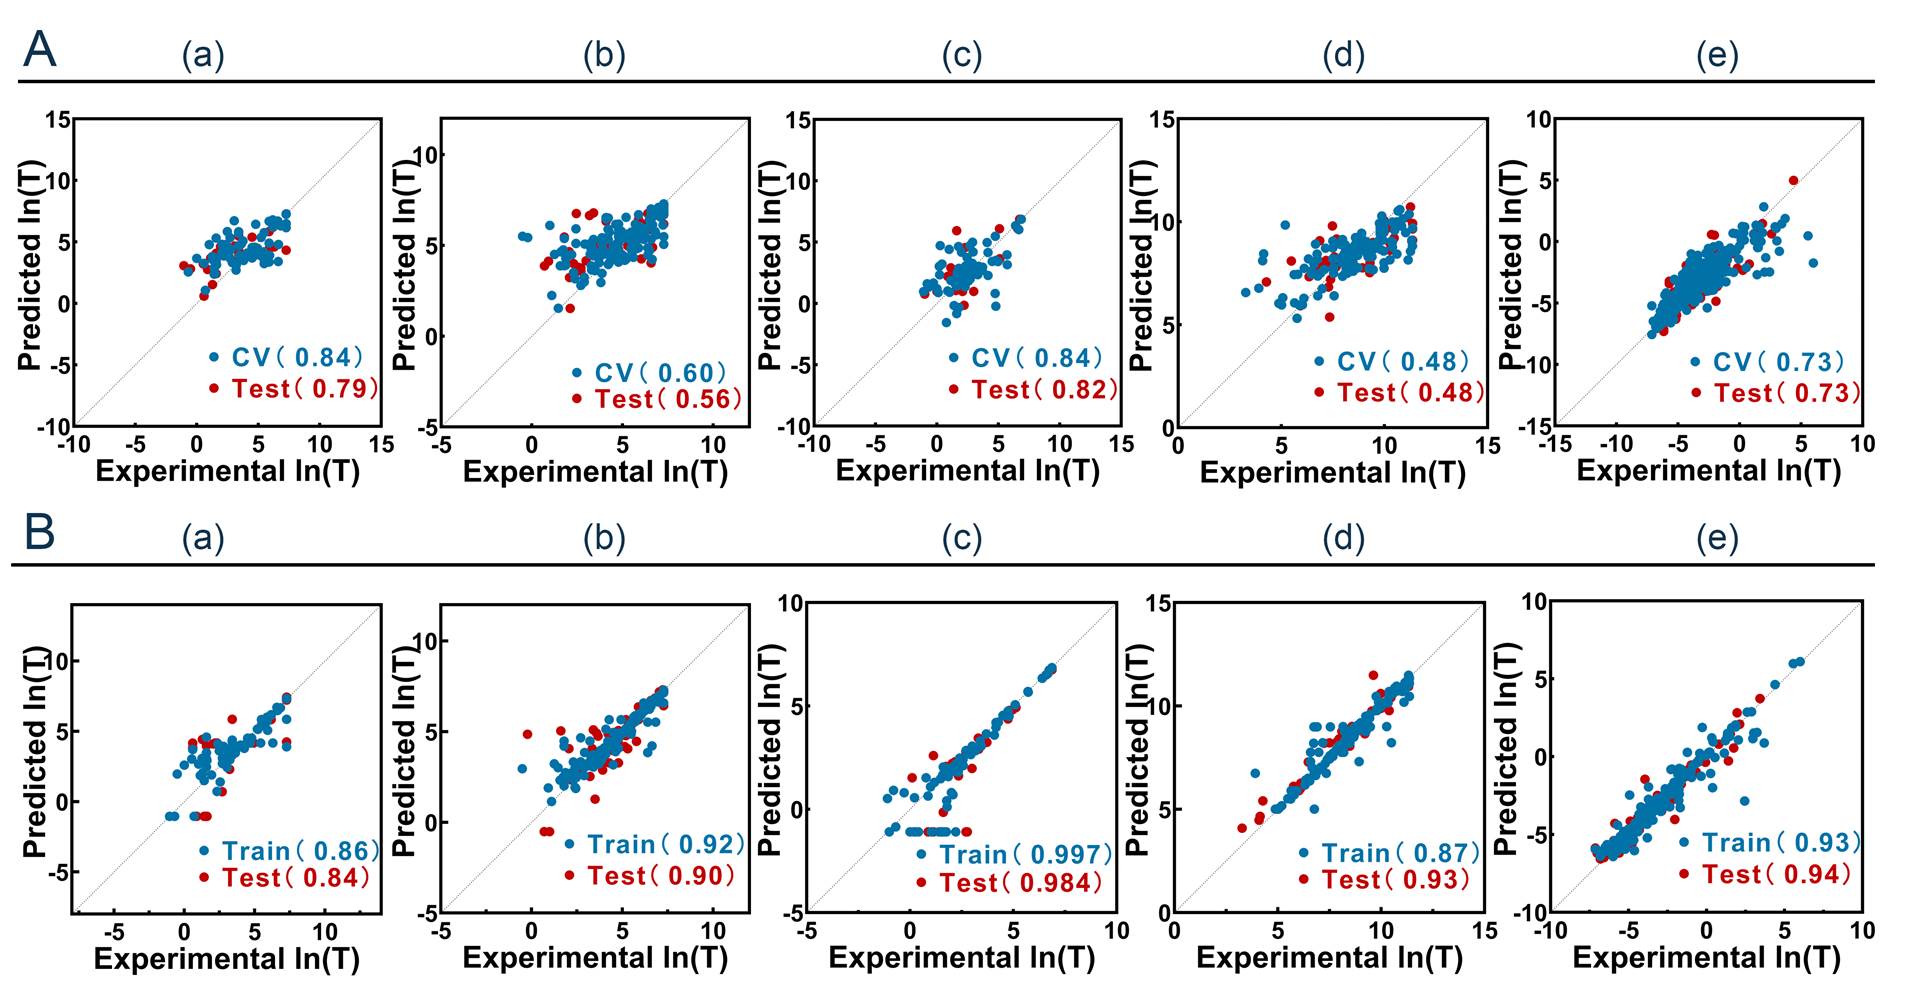
Figure 9. Combined plots of the best model’s results.
Peptide toxicity refers to the ability of peptide molecules to induce
adverse biological reactions in the body, typically manifested as cytotoxicity,
immunotoxicity, and hematotoxicity. Specifically, cytotoxicity refers to the ability
of peptides to damage cellular function or induce cell death; hematotoxicity
can lead to hemolysis or affect the normal function of blood; immunotoxicity
involves peptides triggering allergic or immune responses,
potentially causing allergic reactions or immune system abnormalities.
Dataset
First, we collected 14,660 data from the UniProt database, DBAASP v3 database,
Hemolytik database, and relevant public publications.
Then, these data were categorized into three subsets based on the toxicity presence,
various toxicity types, and types of neurotoxicity, with details showed in Figure 10.
Furthermore, 2,423 hemolytic peptides with accurate HC50 values were extracted
from the aforementioned toxicity records to develop a regression model for HC50 prediction.

Figure 10. Data distribution for different toxicity datasets.
Methods
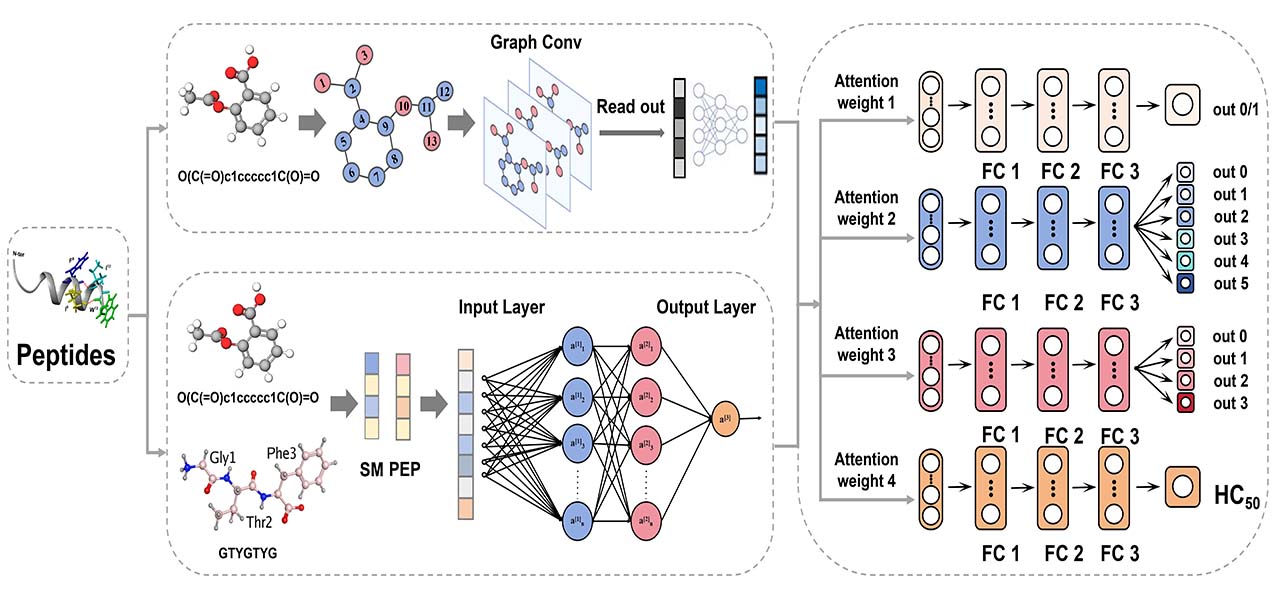
Figure 11. The overview of the MLR-GAT framework.
Model performance
The best model achieved an AUC of 0.885 for distinguishing
toxic and non-toxic peptides, 0.949 for peptide toxicity type classification,
0.905 for neurotoxin classification, and an R2of 0.474 for predicting the HC50
value of hemolytic peptides.

Figure 12. The proposed new stepwise prediction of toxicity and the performance of the best models.